6.3, #8.
The graph of F(x) has a horizontal tangent at x1 and x3.
F increases from x1 to x3 and increases also beyond x3
because its derivative f(x) is positive there.
F is steepest at x2 where f has a local maximum.
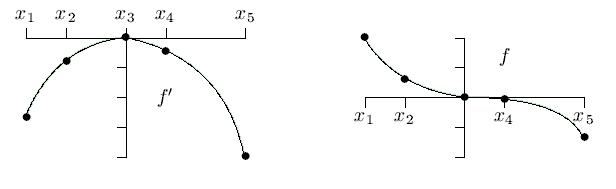
6.3, #16. The graph of fĒĒ shows fĒĒ is greatest at x1 and
least at x5. Moreover, fĒĒ ģ 0 on [x1,x3] and fĒĒ Ģ 0
on [x3,x5]. So fĒ is increasing on [x1,x3], decreasing
on [x3,x5], and fĒ has greatest value fĒ(x3) = 0. Moreover,
fĒ has least value fĒ(x1) or fĒ(x5). The picture given
with the problem has the following feature: the area A of the
region bounded by fĒĒ, the x-axis, and the lines x = x1,
x = x3 is less than the area B of the region bounded by fĒĒ,
the x-axis, and the lines x = x3, x = x5. Since
A = fĒ(x3)-fĒ(x1) and B = fĒ(x3)-fĒ(x5), it follows that
fĒ(x5) < fĒ(x1). Thus fĒ(x5) is the least value of fĒ.
We noted earlier that fĒ(x3) = 0 is the greatest value of fĒ. So fĒ(x) Ģ 0 on [x1,x5] and f is a decreasing function. Thus f has greatest value f(x1) and least value f(x5).
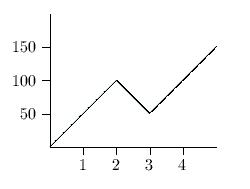
6.3, #17.
It is convenient to separate the three cases: 0 Ģ t Ģ 2, 2 Ģ t Ģ 3, t ģ 3.
For 0 Ģ t Ģ 2, the distance s of the car from the starting point is 50t; at the end of this interval of time, s = 100 miles.
For 2 Ģ t Ģ 3, s = 100-50(t-2); at the end of this interval of time, s = 50 miles.
Finally for t ģ 3, s = 50+50(t-3).
Thus
| ||||||||||||||
6.4, #4-6.
|
6.4, #7-9.
|
6.4, #10-12.
| |||||||||||||||||||||