Simple Example: If the population is divided into two groups - the rich 20%
and the poor 100 − 20 = 80% and the rich
control 90% of the income, the Gini Index is g = 90 −20 = 70.
See Fig.2 in
http://www.cr1.dircon.co.uk/pdffiles/Lorenz.pdf
Thus the Gini Index is the incremental advantage of the
rich population.
Calculation: The Gini coefficient is calculated as a
ratio of the areas on the Lorenz curve diagram. If the area
between the line of perfect equality and Lorenz curve is A, and
the area underneath the Lorenz curve is B, then the Gini
coefficient is A/(A+B).
•
Advantages and Disadvantages
of the Gini coefficient as a measure of inequality
•
Advantages: Anonymity, Scale independence, Population independence
•
Disadvantages: Units of Measurement, Households
vs. Individuals, Definition of Income.
•
Policy Considerations: FRBSF: Economic Letter - Inequality in the United States
http://www.frbsf.org/econrsrch/wklyltr/el97-03.htmlSimple Example
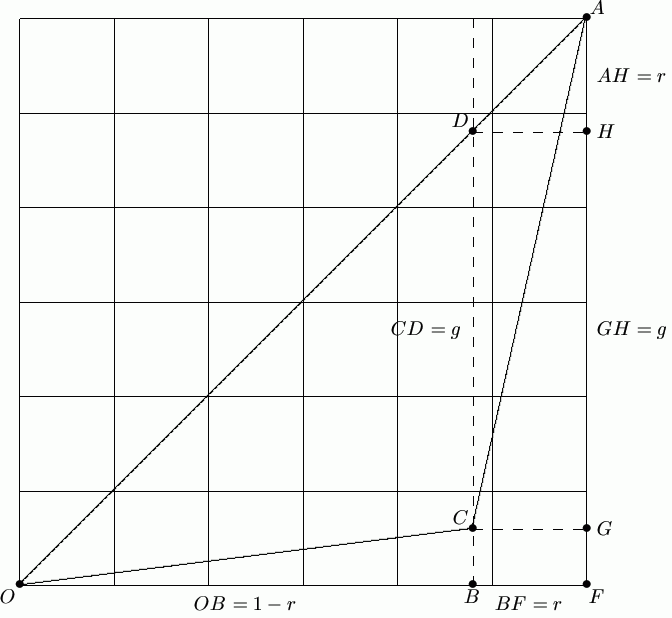
Simple Example: If the population is divided into two groups -
the rich proportion r and the poor proportion 1− r and the rich control an r + g proportion of the the
total income, the Gini Coefficient is g = (r + g) − r. If there
was complete equity , the rich would control r and g
represents the incremental advantage of the rich.
In the figure, A = (1,1), q = GH = CD, and
Area ∆OCA
= Area ∆OCD + Area ∆DCA
=
1
2
CD ·OB +
1
2
BF ·OB
=
1
2
CD ·OF
=
1
2
q,
or
Area ∆OCA
Area ∆OFA
= q.
Footnotes:
1N.B. In the Staples paper, the Gini
coefficient is called the GINI index .
File translated from
TEX
by
TTH,
version 3.76. On 31 Oct 2006, 10:30.